Getting started
How to write a description the AI can work with, what to check before the chart is built, and what to do with it after.
1. Describe the project
Creating your first timeline takes a few minutes. The description is where most of the quality comes from.
 Tap to open full size
Project setup
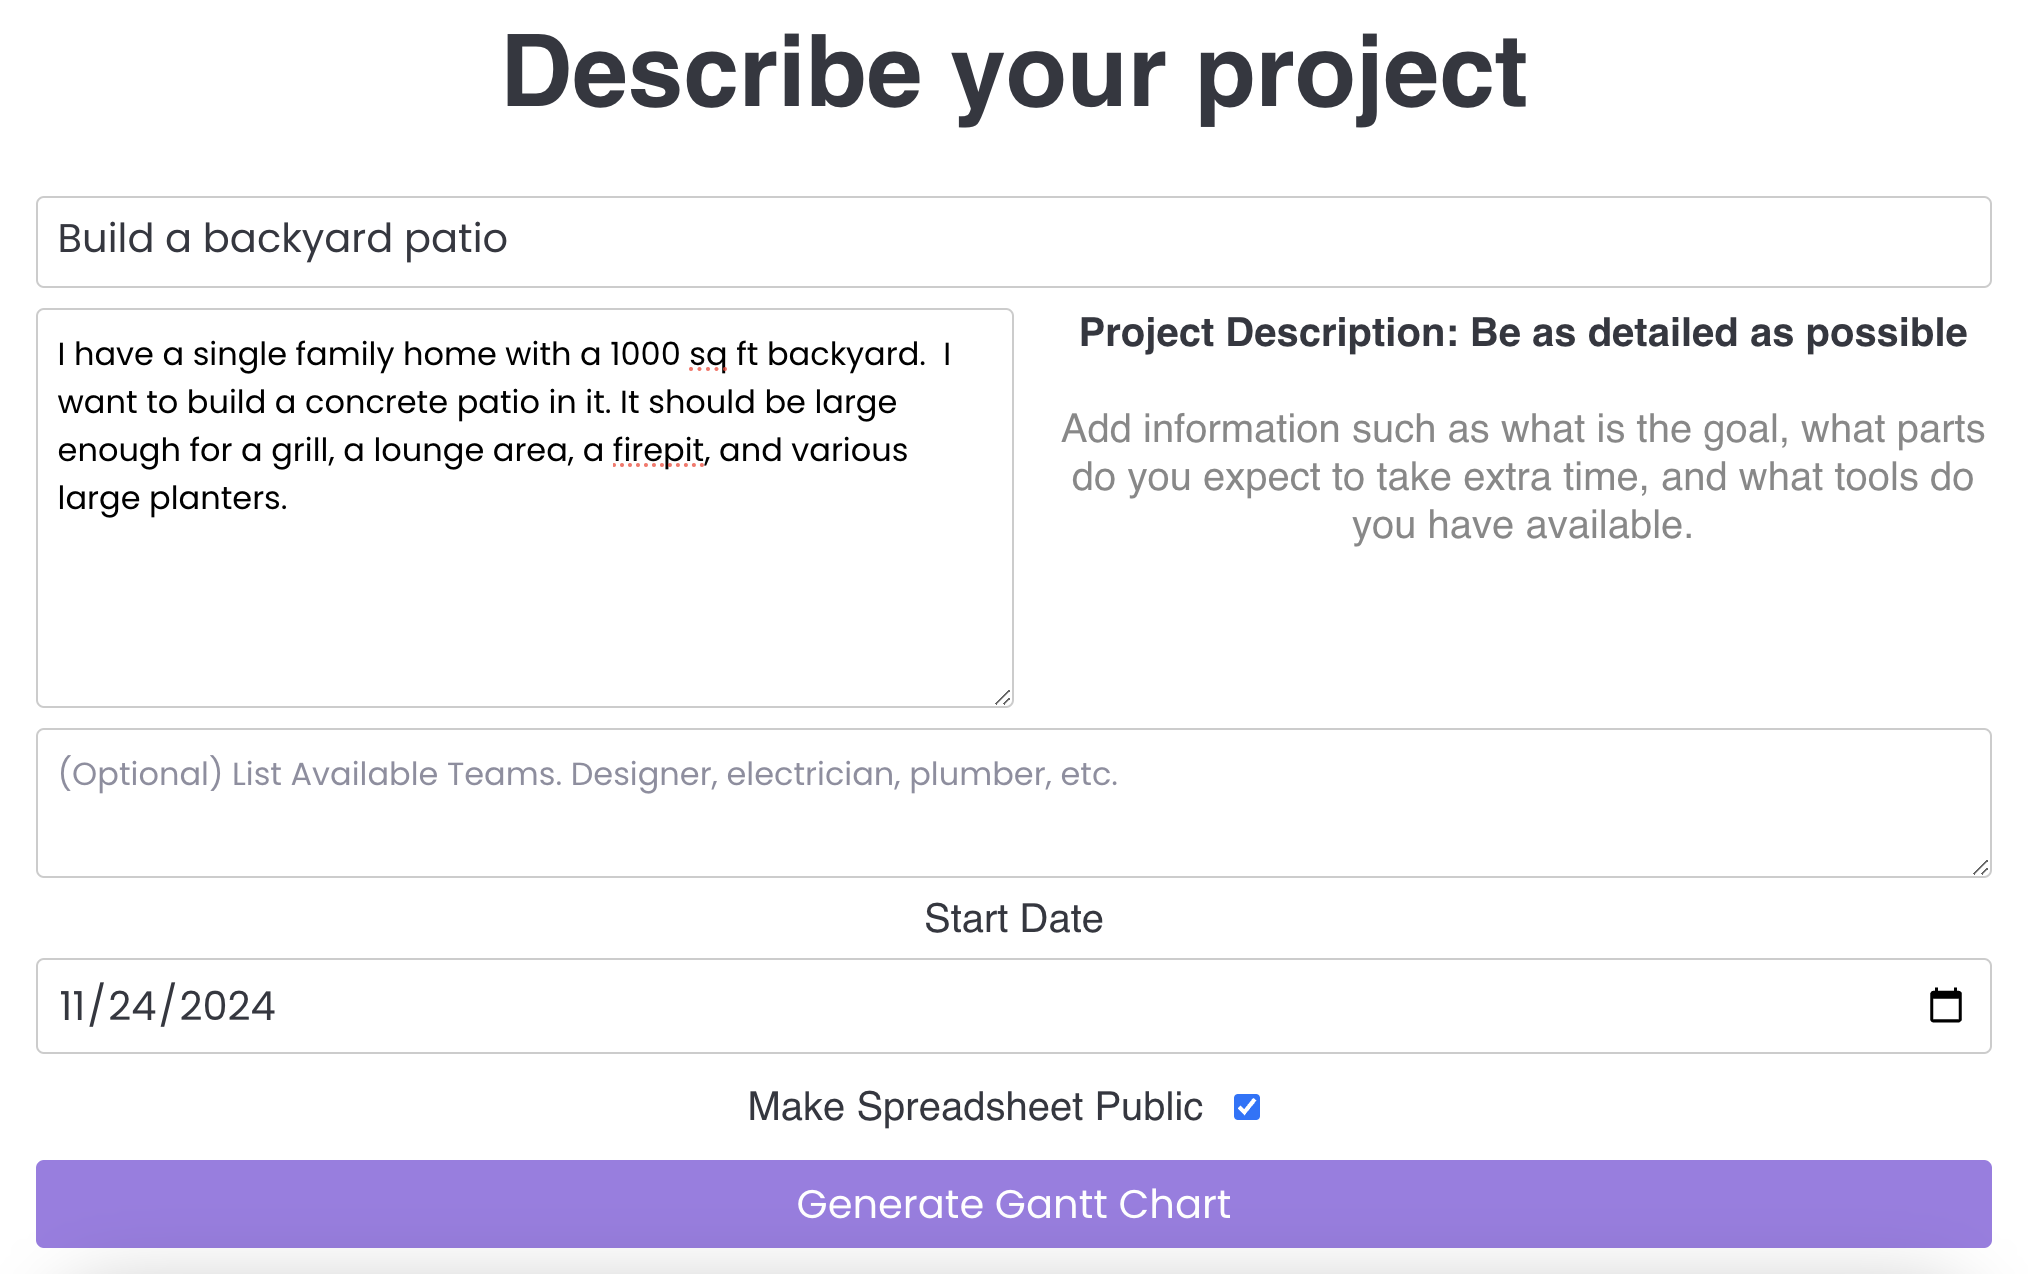
Give it a clear name
Something you would recognise in a list later. "Build a backyard patio" beats "Project 3".
Write the description like you would explain it to a colleague
The more specific you are, the better the schedule. Say what the goal is, what has to happen, and anything you already know will be hard. For example:
List the people or teams (optional)
Each one becomes a workstream with its own color and filter. "Myself (painter), neighborhood organizer, social media person" is plenty.
Set the dates
A start date is required. An end date is optional. We recommend adding some buffer time to account for unexpected delays.
 Tap to open full size
Generate milestones
Click "Generate my chart" to let the AI draft the timeline. Make sure you are signed in, since the chart is saved to your account.
This usually takes less than 2 minutes.
2. Review and edit
 Tap to open full size
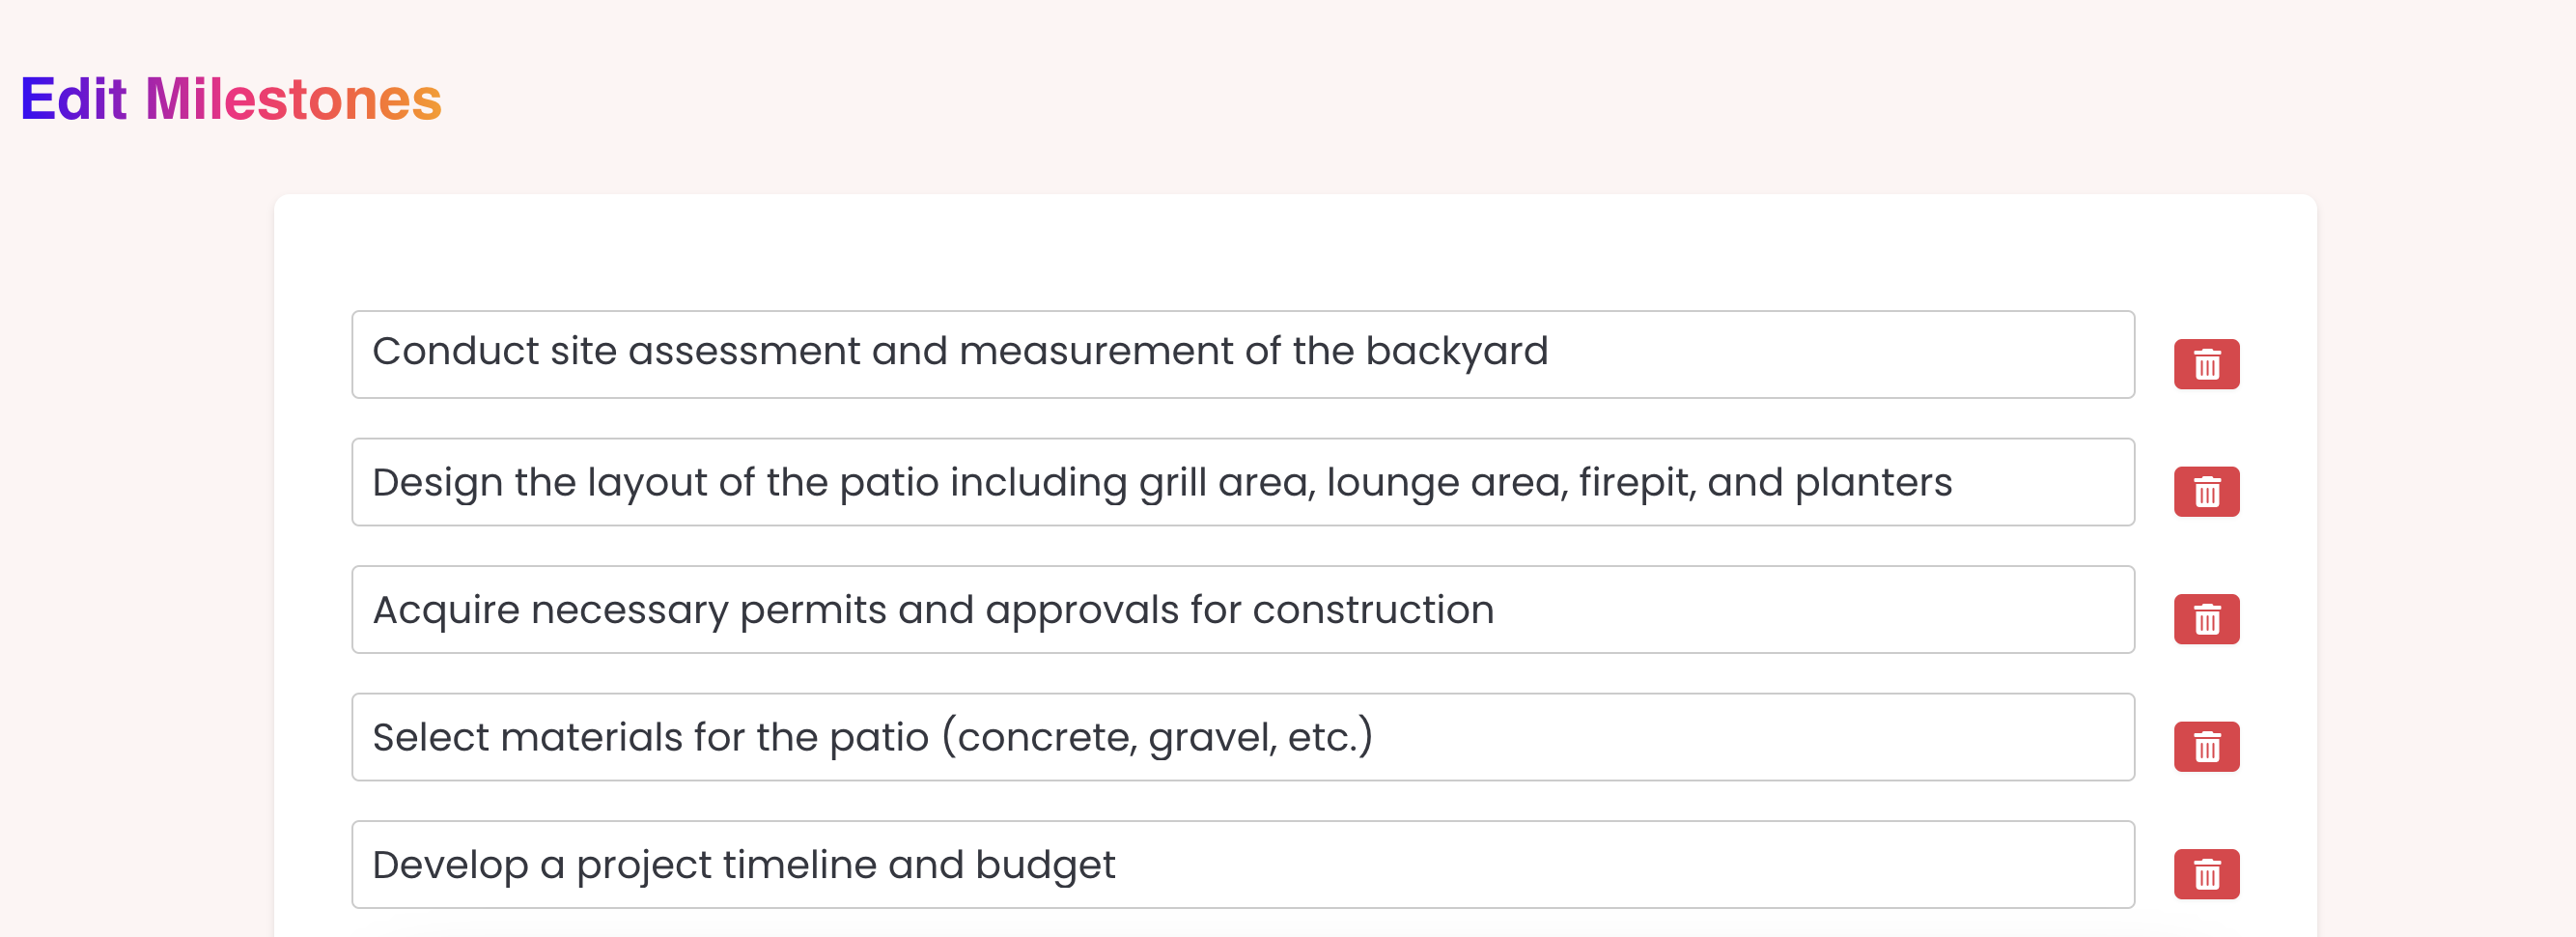
Review and customize your project timeline:
- Check each milestone is relevant to your project
- Edit milestone details and durations
- Add or remove milestones as needed
- Click "Build the chart" when you are happy with it
3. Edit, share and export
 Tap to open full size
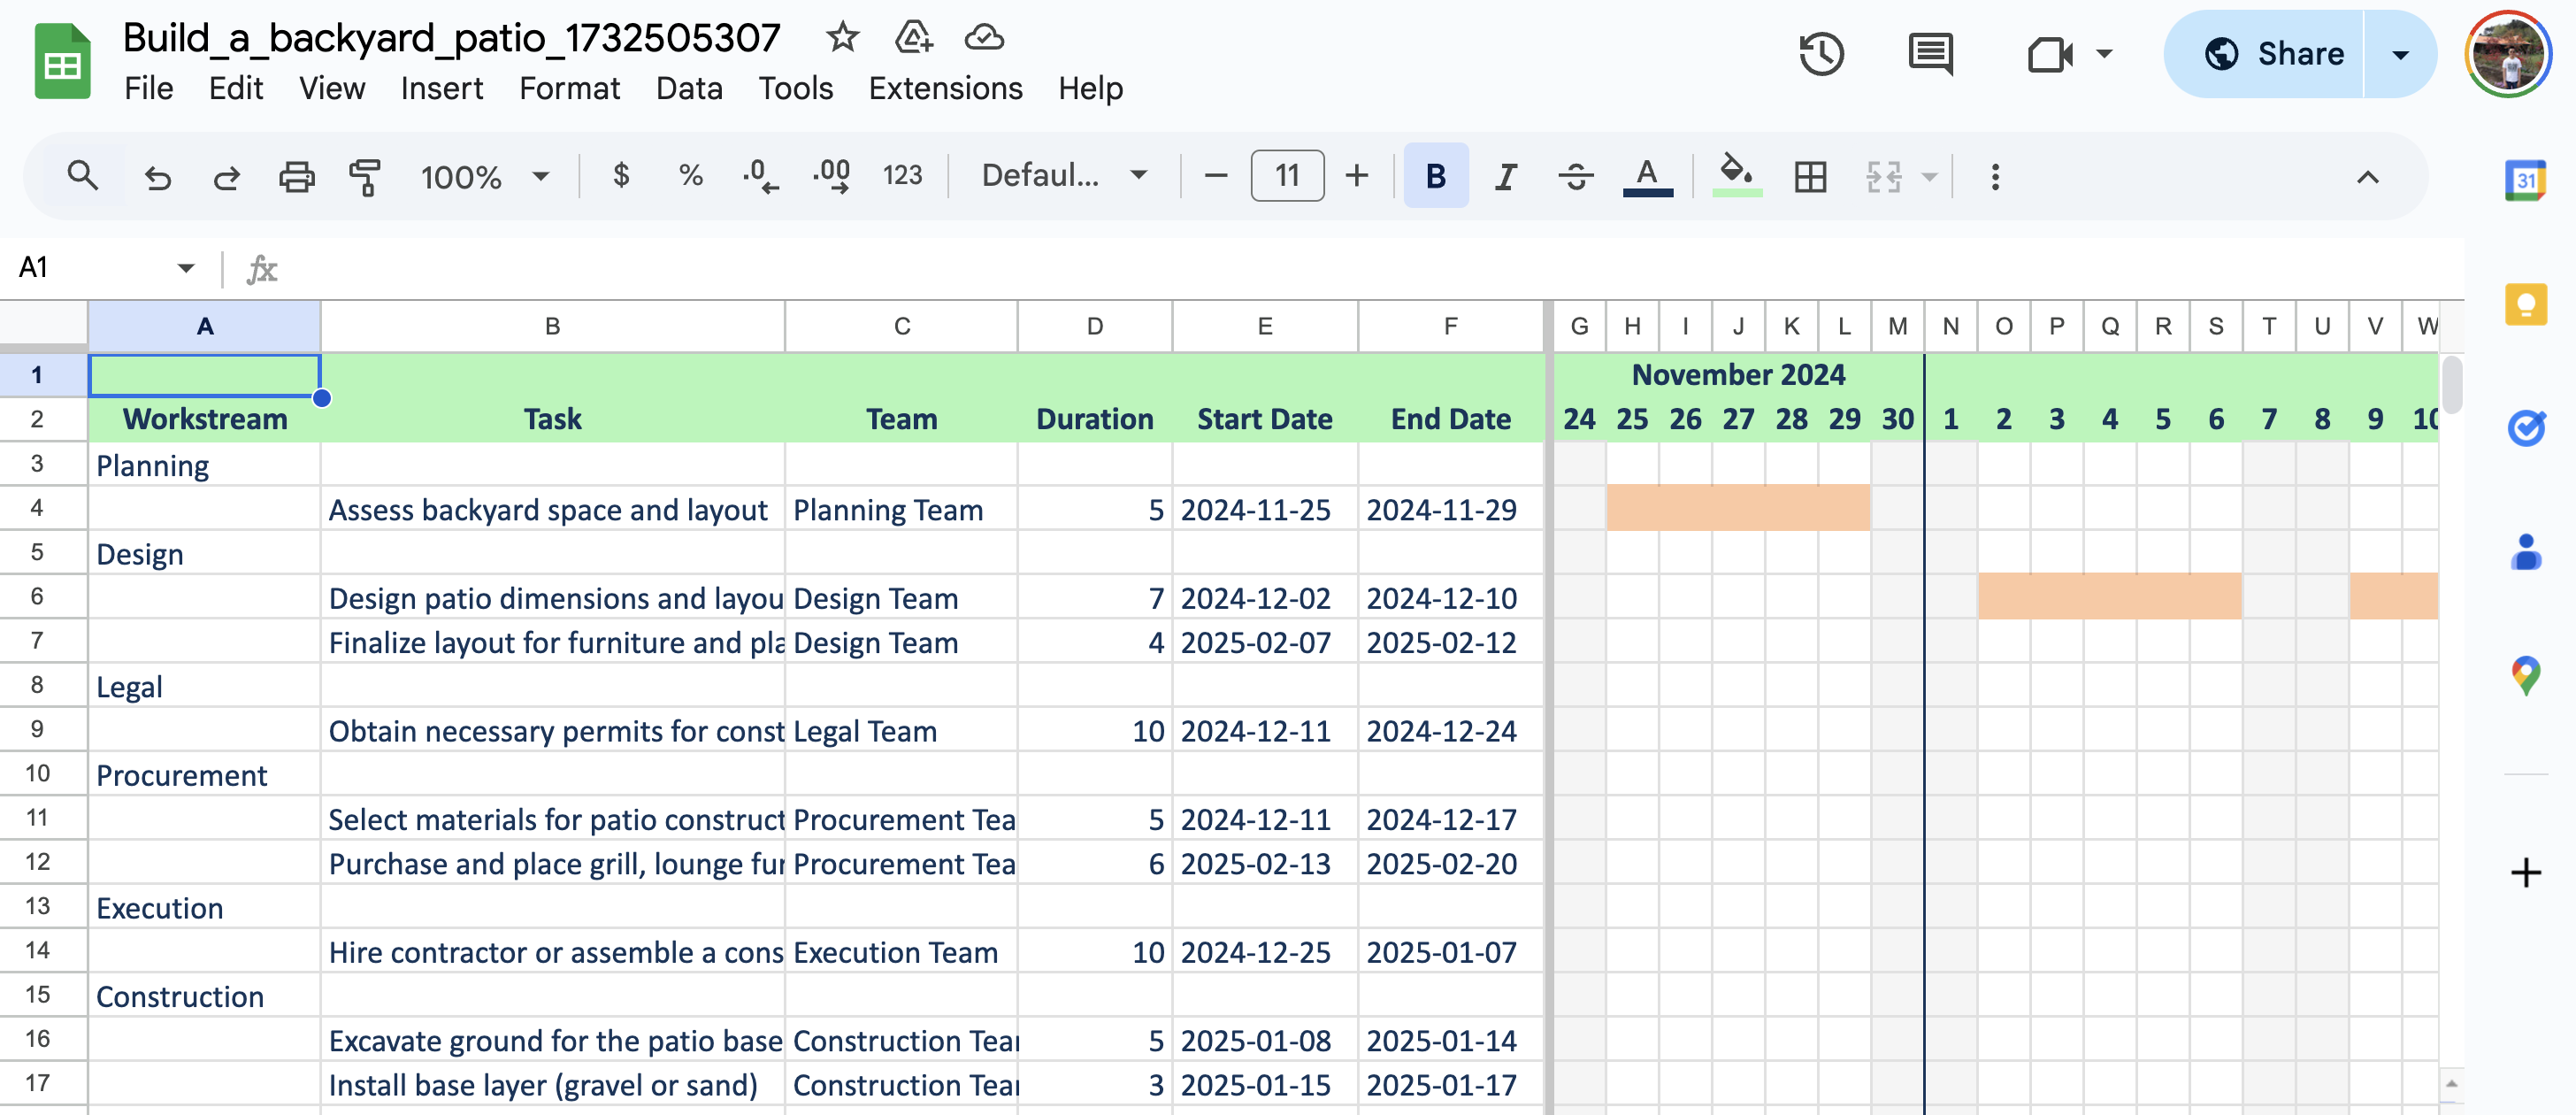
Your chart opens in the editor and is saved to your account. From here you can:
- Drag bars to change dates. Tasks that depend on them move too.
- Assign owners, and filter by workstream or person
- Share a link with your team
- Export to Google Sheets, Excel, CSV or JSON
Questions
How long does it take to generate a Gantt chart?
Usually less than 2 minutes from start to finish.
What is on the roadmap?
An automated Gantt chart grooming Slack bot, to make project management even easier.
How can I give feedback?
We would love to hear from you. You can:
- Email us at [email protected]
- Join our Discord community