Frequently Asked Questions
Learn more about Gantt Charts, their origins, uses, and how to effectively use them to plan your projects.
What is a Gantt Chart?
What is a Gantt Chart and how does it work?

A Gantt chart is a visual project management tool that displays a project schedule by showing the start and finish dates of various elements of a project, including tasks, milestones, and dependencies.
The chart consists of horizontal bars that represent tasks, with the length of each bar indicating the duration of the task. The horizontal axis represents time, while the vertical axis lists the tasks or activities in the project.
Gantt charts make it easy to:
- Visualize the complete project timeline
- Identify dependencies between tasks
- Track progress against planned schedules
- Optimize resource allocation
- Communicate project status to stakeholders
What are the key components of a Gantt Chart?
A comprehensive Gantt chart typically includes these key components:
- Tasks/Activities: Work elements that need to be completed
- Timeline: The horizontal axis representing the project duration
- Task Bars: Horizontal bars showing task durations
- Milestones: Significant points or events in the project
- Dependencies: Relationships between tasks (e.g., task B can't start until task A is complete)
- Progress Indicators: Visual representation of completed work
- Resource Allocation: Assignment of team members or resources to tasks
Origins and History
Who invented the Gantt Chart?

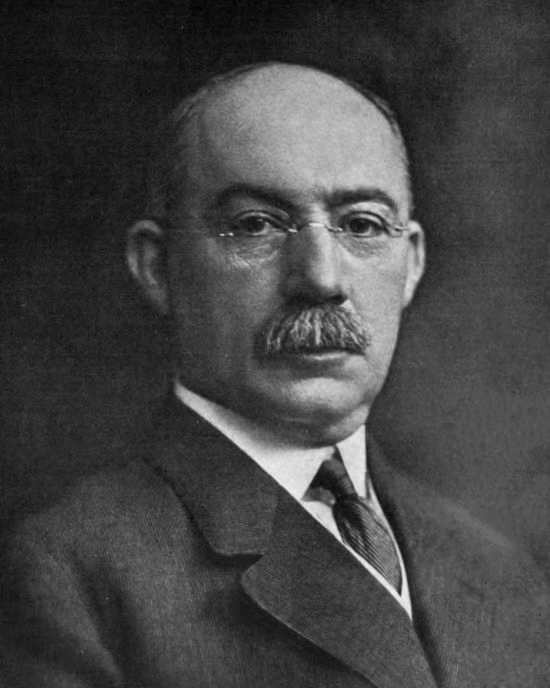
The Gantt chart was developed by Henry Laurence Gantt (1861-1919), an American mechanical engineer and management consultant who was a pioneer in scientific management.
Gantt created this charting technique around 1910-1915, during his work with the United States Army during World War I. His charts were used to track production and were revolutionary in visualizing work schedules.
While similar scheduling charts had been used before, Gantt refined and popularized the format, which is why they bear his name today.
How have Gantt Charts evolved over time?
Gantt charts have evolved significantly since their invention:
- 1910s-1920s: Originally drawn by hand on paper, primarily for industrial manufacturing
- 1950s-1960s: Adapted for construction and engineering projects
- 1980s: First computer-based Gantt chart software emerged
- 1990s-2000s: Integration with resource management, cost tracking, and other project management tools
- 2010s-Present: Cloud-based, collaborative Gantt chart tools with AI assistance (like Gantt Chart AI), mobile accessibility, and real-time updates
Modern Gantt charts have become more dynamic, interactive, and connected to other project management systems.
Uses and Applications
What types of projects are Gantt Charts best for?
Gantt charts are particularly effective for:
- Construction projects: Coordinating multiple contractors and phases
- Software development: Managing sprints and development cycles
- Product launches: Coordinating marketing, manufacturing, and distribution
- Event planning: Organizing logistics and timelines
- Research projects: Tracking experiments and study phases
- Manufacturing: Scheduling production runs and resource allocation
- Content creation: Managing editorial calendars and production schedules
They are most valuable for projects with clear tasks, definable durations, and sequential dependencies.
What are the benefits of using Gantt Charts?
Gantt charts offer numerous benefits for project management:
- Visual clarity: Providing an intuitive visual representation of the project timeline
- Improved planning: Forcing detailed consideration of tasks, durations, and dependencies
- Progress tracking: Making it easy to identify delays and bottlenecks
- Resource management: Helping allocate resources efficiently
- Communication: Offering a clear way to communicate project status to stakeholders
- Flexibility: Allowing for adjustments as project conditions change
- Accountability: Clearly showing who is responsible for each task
Best Practices
What are some best practices for creating effective Gantt Charts?
Follow these best practices when creating Gantt charts:
- Keep it simple: Avoid overloading the chart with too many tasks
- Use a hierarchy: Group related tasks into phases or categories
- Set realistic timeframes: Be honest about how long tasks will take
- Include buffer time: Add some flexibility for unforeseen delays
- Clearly mark dependencies: Make relationships between tasks obvious
- Update regularly: Keep the chart current as the project progresses
- Highlight milestones: Make important project checkpoints visible
- Use consistent color coding: Make the chart easier to read with a visual system
How detailed should a Gantt Chart be?
The appropriate level of detail for a Gantt chart depends on the project and audience:
- For high-level stakeholders: Less detail, focusing on major phases and milestones
- For project teams: More detail, including individual tasks and dependencies
- For complex projects: Consider using a master chart with high-level information and sub-charts for detailed planning
Common mistake: Creating overly detailed Gantt charts that become unwieldy to manage. Aim for enough detail to guide work effectively without becoming overwhelming.
With Gantt Chart AI, you can easily adjust the level of detail by specifying more or less detailed descriptions in your project input.
Using Gantt Chart AI
How does Gantt Chart AI simplify project planning?
Gantt Chart AI transforms project planning through its innovative AI-powered approach:
- Natural language input: Simply describe your project in plain English
- Automatic task generation: The AI identifies and creates appropriate tasks
- Intelligent scheduling: Automatic calculation of durations and dependencies
- Quick iterations: Easily modify and refine your project with simple text commands
- Professional output: Generate visually appealing and functionally complete Gantt charts
- Time savings: Reduce planning time from hours to minutes
Gantt Chart AI is especially valuable for those who aren't project management experts but need professional project plans.
Can I export or share my Gantt Charts?
Yes, Gantt Chart AI provides multiple ways to use your generated charts:
- Export to Excel format for further customization
- Access all your charts from your dashboard when logged in
- Share your charts with team members by exporting the files
This flexibility allows you to use your Gantt charts in presentations, team meetings, client communications, and other project management systems.